How I Counted When America Drinks Caffeine
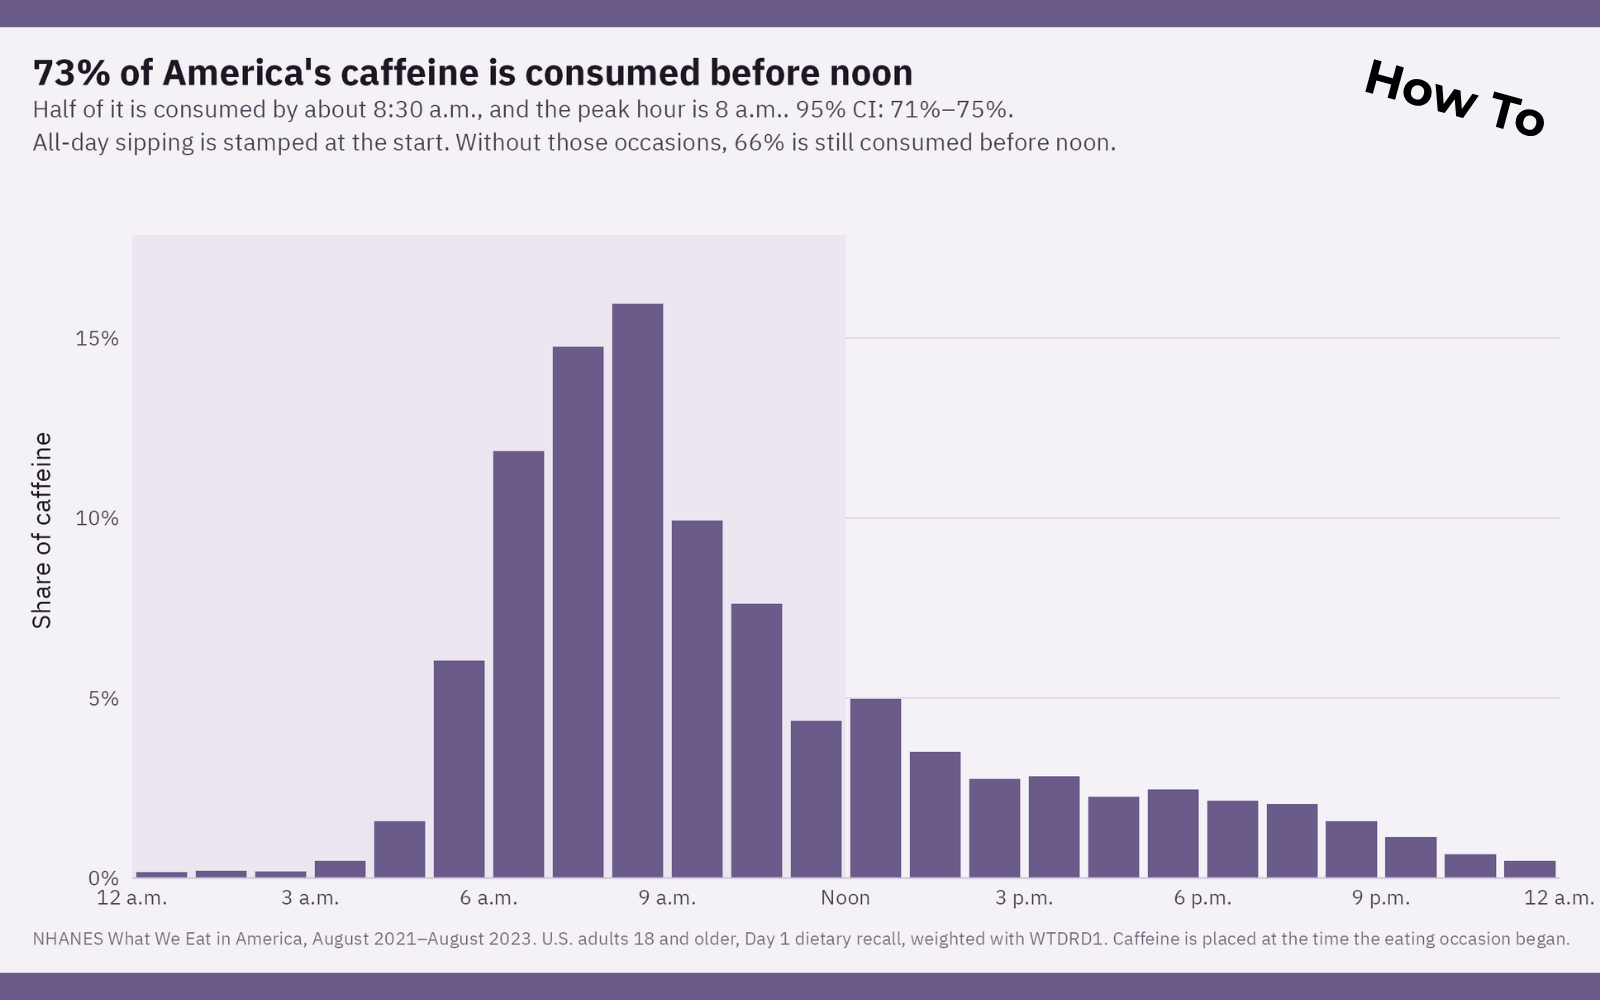
The 73% chart is one survey, not a vibe check. CDC asks people what they ate and drank yesterday. The interview writes down the clock time and the caffeine in each item. I added the milligrams up by hour.
This is the version with the column names, the annoying bits, and the files. If you want the pictures, they’re on the other post. If you want to redo the math, the CSVs are below.
The file
The cycle is August 2021 through August 2023. That’s the newest public release of NHANES, the National Health and Nutrition Examination Survey. The piece that matters is the individual foods file from What We Eat in America. One row per food or drink.
Two fields do almost all the work:
- DR1_020, the time they started eating or drinking
- DR1ICAFF, the milligrams of caffeine in that item
I kept people whose first-day recall was marked reliable. That’s 6,691 people of every age. The adult charts use the 4,983 of them who are 18 or older. Teens stay in the download, because their clock is the interesting comparison.
The weight
NHANES is not “whoever answered.” Some people are more likely to be in the sample than others, and the dietary interview adds another adjustment for weekday versus weekend. Each person gets a Day 1 dietary weight, WTDRD1.
A milligram from someone with a bigger weight stands in for more people. Every chart uses that weight. If you average the rows like a normal spreadsheet, you will not get 73%.
To recreate the headline from caffeine-occasions.csv: keep age_years 18 and up, multiply dietary_weight by caffeine_mg, and divide the morning total (hour under 12) by the total for the whole day. The weight repeats on every food a person reported. Don’t add those weights up and call the result a count of people. The person count lives in persons.csv, one row each, including the people who had zero caffeine.
The 95% intervals on the other post also use the survey’s cluster and stratum, psu and strata in the persons file. A plain average in Excel will not give you those intervals. That’s fine. The point estimates are the chart.
Coffee, soda, energy drinks
The survey does not hand you a column called energy drink. It hands you a food name, like ENERGY DRINK (MONSTER) or COFFEE, BREWED. I sorted the names in this order:
- If it says energy drink, it’s an energy drink.
- Then coffee or espresso.
- Then tea, as its own word, so “steak” doesn’t get caught.
- Then soft drink.
- Then chocolate or cocoa.
- Everything else is Other. Other is a rounding error.
That label is the source column. You can ignore it and group food_name yourself.
The parts that are easy to get wrong
Sipping. If someone nurses one coffee all morning, the recall often stores that as a single occasion at the time they started. Those rows are extended_sipping = 1. Drop them and the before-noon share goes from 73% to 66%. Still a morning country. Just less dramatic.
Shots and pills. Energy shots and caffeine pills are supplements in this survey, so they never land in the food file. These CSVs are foods and drinks.
The phone. Day 1 of this cycle was collected by phone. Older cycles did the first day in person. I would not stack the years and call a small gap a change in how people drink. CDC has a note on that mode change, and the same kind of recall goes back to 2003–2004 if you want to try the comparison carefully.
Download the CSVs
These are the public-use rows, cut down to the columns this chart needed, plus the summary tables behind the pictures. The original CDC files are SAS transport files with dozens of extra nutrients. This is the smaller version.
Age groups and the weekday split are written with a plain hyphen: 12-17, Monday-Thursday, Friday-Sunday. A fancier dash in those cells turns into junk like Friday– when Excel opens the file.
Use them for statistical analysis and reporting. Don’t try to figure out who a row is. Don’t join them to another dataset that names people. That’s the NCHS data user agreement, in short.
Cite the source if you publish something from it: Centers for Disease Control and Prevention (CDC). National Center for Health Statistics (NCHS). National Health and Nutrition Examination Survey Data. Hyattsville, MD: U.S. Department of Health and Human Services, Centers for Disease Control and Prevention, 2024. August 2021–August 2023 dietary data.
Row-level files
- persons.csv — one row per person, including people who drank no caffeine. 436 KB.
- caffeine-occasions.csv — one row per caffeinated food or drink, with the clock time. 1.1 MB.
The tables behind the charts
- hourly.csv — share of adult caffeine by hour
- hourly-by-source.csv — coffee, tea, soda, energy drinks, chocolate
- hourly-by-age.csv — age groups written as 12-17 through 65+
- hourly-by-week.csv — Monday-Thursday and Friday-Sunday
- hourly-by-sex.csv
- first-caffeine-hour.csv — when adult caffeine consumers started
- data-dictionary.csv — what each column means
The full nutrient files, if you want more than caffeine, are on the CDC dietary data page. Food names come from the USDA Food and Nutrient Database for Dietary Studies, which FoodData Central also publishes.
Related
Stay Updated
Get notified about new posts, energy drink releases, and exclusive deals.
Subscribe to Newsletter